
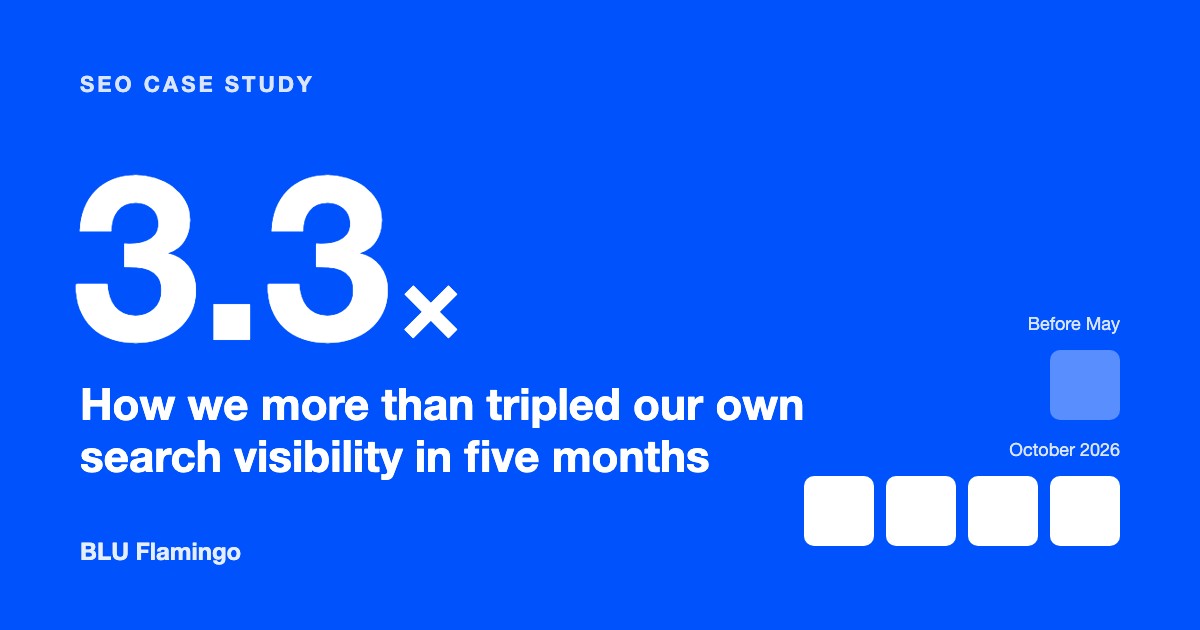
SEO Case Study: How We Tripled Our Search Visibility in 5 Months
This SEO case study is about our own website. Between May and October 2026, we more than tripled how often bluflamingo.net appears in Google search, and all of that growth was earned through organic search. Below, we share where we started, how we approached the work, what changed, and the principles we now bring to every client engagement.
The Results at a Glance
The Starting Point
By early 2026, bluflamingo.net had grown alongside the business: six offices across Africa and the UK, a broad service range and nearly ten years of published articles. The site was built for people first, and it served visitors well. Our next step was to make it just as clear to search engines, so that buyers could find us without already knowing our name. We saw three opportunities.
The BLU Newsletter — FREE
Get What’s Working in Marketing Right Now
WhatsApp funnels, AI search, the ad platforms outperforming everyone. Get the useful content before it’s obvious — from an agency in the middle of it across 5 countries.
Join thousands of marketers. Unsubscribe anytime.
- Make every page as clear to Google as it is to a visitor. Modern, app-style websites give people a fast experience, but they need extra care before search engines can read them in full.
- Give each service and each market its own voice. As our offer grew across Africa and the UK, our pages needed to speak more directly to buyers in each country.
- Bring all our expertise under one address. Our blog lived at its own address, so the credibility it earned was not adding to the main site.
We also chose to measure everything in Google’s own tools, chiefly Google Search Console. Most SEO research tools hold little data on East African search, and we wanted figures we could rely on. If you are setting up your own reporting, our guide on how to measure the success of your SEO strategy covers the basics.
Our Approach
We ran the work in four stages, each building on the one before. Every change went through our usual quality review before it went live.
- May – June
Site healthEvery page made as clear to Google as it is to a visitor.
- June
Clearer pagesService and local market pages written for the buyer each one serves.
- July – August
Market guidesPractical guides for marketing leaders in Uganda, then Rwanda.
- September
One domainThe blog moved home, so everything builds one site’s reputation.
The order mattered. We strengthened the foundations before publishing anything new, because content only performs when search engines can read the site properly. The market guides then followed a planned structure, an approach we explain in our article on topical authority for African brands.
The Results
Each stage of the work lifted our visibility in Google, and the gains have held. By October, our pages were appearing in search about four times as often as they did, on average, in the eight months before May.
Growth was not a straight line. Visibility dipped in August before climbing again, and the move to a single domain at the end of September gave the largest lift of the year.
Just as important is who now finds us. We appear on Google’s first page when buyers search for business-to-business, advertising and sector-specialist agencies in Kampala, Kigali, Nairobi and South Africa. Rwanda is the market where search turns into visits most readily, and our new market guides now rank alongside our service pages.
- KampalaPage one
- KigaliPage one
- NairobiPage one
- South AfricaPage one
What We Learned
Working on our own site sharpened five principles we now bring to every client engagement.
- Get the foundations right before publishing more. Content only performs when search engines can read the site properly.
- Be specific before going broad. Focused local searches are where a brand earns its first wins in a crowded market.
- Keep your expertise under one roof. One domain gathers credibility; two divide it.
- Measure with the right instruments. In East African markets, Google’s own data is the reliable guide.
- Be seen first, then be chosen. Once a brand is visible, how it presents itself in the results decides who clicks.
Frequently Asked Questions
How long does SEO take to show results?
In our case, visibility began to rise in the first month of work and more than tripled within five months. Every site starts from a different place, so the timeline depends on the site’s condition and how competitive its market is.
Why measure SEO in Google Search Console rather than third-party tools?
Third-party SEO tools estimate search data, and their estimates for Uganda, Rwanda and much of East Africa are thin. Search Console reports what Google itself recorded for your site, which makes it the most reliable source in these markets. We cover this in more depth in our guide to SEO for Ugandan businesses.
Does this approach work outside East Africa?
Yes. The principles behind this SEO case study apply in any market, and we use them with clients across Africa and the UK. Our SEO guide for African businesses is a good place to start.
What Comes Next
Our next phase will turn this visibility into more conversations, through sharper search listings, more local market pages and wider recognition from respected publications. We will share the results of that stage in the new year.
If your brand is ready for the same kind of growth in search, explore our search engine optimisation services or talk to our team.
About the data: figures come from Google Search Console (web search on bluflamingo.net, including the blog, September 2025 to mid-October 2026) and Google Analytics 4 (January to October 2026). Before-and-after comparisons use equal 30-day periods. To protect commercial information, results are shown as relative change rather than raw counts.
